Monitoring
BetterFall
Overview
See when fall colors will peak, right on your Xeneon Edge. BetterFall shows a county-by-county map of the United States that changes color as the fall season moves along, so you can tell at a glance where the leaves are turning.
Features
Each county is colored by where it is in the fall season: None, Little, Moderate, High, Peak, or Past Peak. The colors advance every day based on that county's estimated peak date.
Type your county name and state, and the map centers on that location.
Move the map horizontally and vertically, and zoom in or out, so it fits your display.
Hide the top bar, the bottom bar, or both.
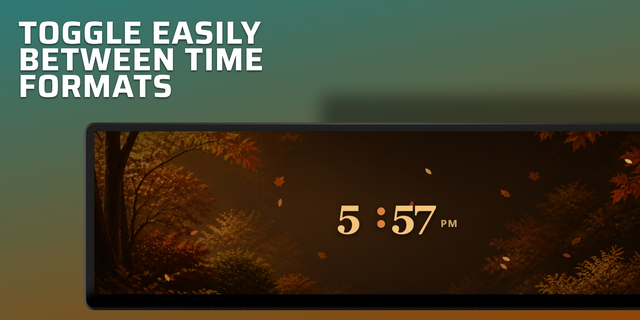
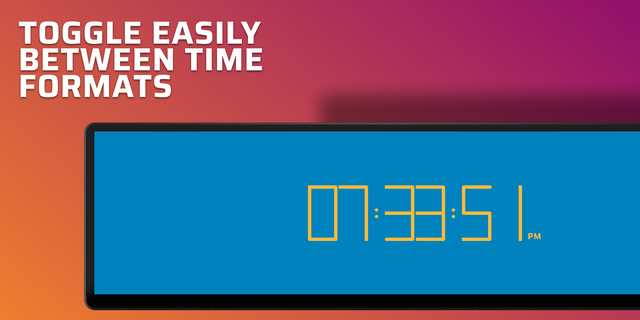
Show the time, the date, or both together.
Able to hide the legend and the peak date to leave only your county's name.
Hover over any county to see its estimated peak date.
The map resets on January 1st.
Disclaimers
Peak dates are entered manually, so the map does not change from year to year.
This widget shows a best guess at each county's peak date. It is not fully accurate.
County peak dates may be off by a week or more.
Counties in the west are less accurate because they are much larger than counties in the east.
Only works inside of the United States.
If you find any bugs, please contact me!
Fixed an issue where the widget would not work with the touch screen.
Fixed an issue where the county foliage information window would be stuck on the screen when navigating outside the widget.
Version 1.0.1
Oct 15, 2026
Details
Type
Monitoring
Device
XENEON EDGE
OS
Windows
Size
1.14 MB
Version
1.0.1
Language
English
Support
Dashboard Sizes
Extra large
Large
Medium
Small
Recommended Orientation
Horizontal
Interactive
Yes
You might also like