Development
Grafana
Overview
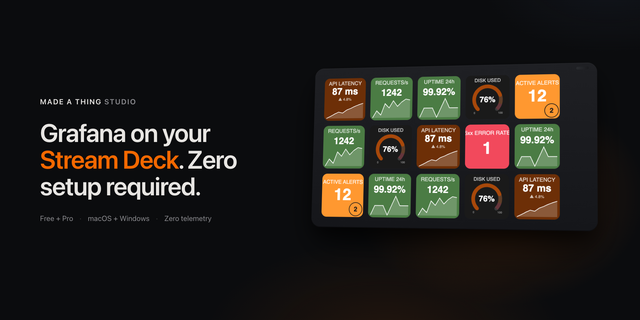
Stop tab-switching and start leading with the persistent hardware sentinel for your Grafana ecosystem. By moving mission-critical metrics to your Stream Deck, you eliminate the cognitive tax of uncertainty and reclaim your deep-work flow state. Gain the ultimate competitive advantage with a dedicated, "un-interruptible" signal that ensures you are never caught off guard by a system drift. Transform your desk into a high-stakes command center that signals elite-level discipline and mastery to your team and your leadership.
Supports:
Grafana API support (follow the setup guide in the Property Inspector).
Auto-import your existing Grafana Dashboard Stat & Gauge visualisations.
Custom Prometheus datasources & queries.
Template $variables with selectable lookups for Prometheus datasources.
Custom time ranges and refresh intervals.
Custom threshold colours and values.
AES256 bit encrypted token storage (on top of Elgato's DRM protection).
Coming soon:
Value mapping support.
Grafana Alerts.
Datasource support for: WebSockets, MQTT & InfluxDB.
Note: While this plug-in is built for monitoring remote infrastructure, it is the perfect solution for power users running a dedicated Streaming/Monitoring PC. Use it on your secondary machine to pull real-time telemetry from your Gaming PC via Grafana (Alloy / Node Exporter). Watch your frame times, temps, and network health on your Stream Deck without sacrificing a single cycle of performance or screen real estate on your primary rig. It’s the "Out-of-Band" monitoring setup used by the pros.
Added support for named CSS colours. Now your Grafana dashboards can be saved with named colours such as 'red' and 'green' and the plugin with import them correctly. Many thanks to LordSaibat for their help in fixing this issue.
Version 1.0.0.2
May 1, 2026
Details
Type
Development
Monitoring
OS
Mac
Windows
Compatibility
Stream Deck 6.9 or later
Size
159.29 KB
Version
1.0.0.2
Language
English
Support
Profiles
No
Dial support
No
You might also like