Monitoring
Proxmox Dashboard
by TeaTime
Overview
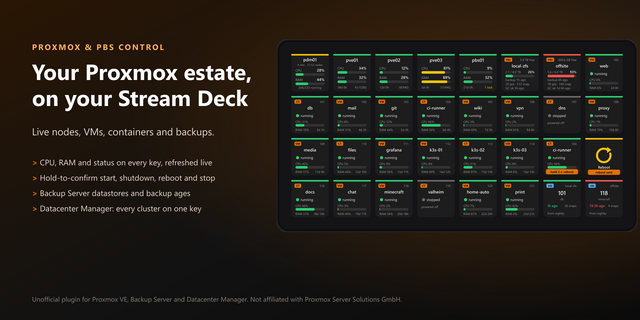
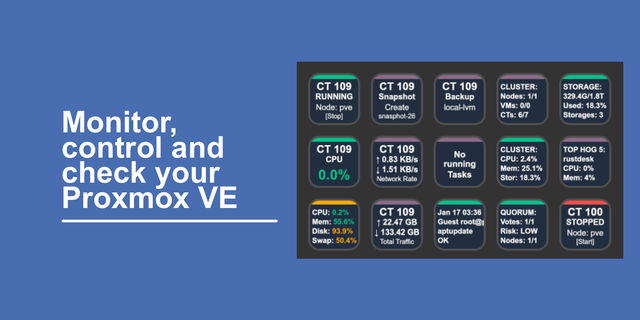
Proxmox Dashboard puts your Proxmox homelab on the CORSAIR XENEON EDGE: every server's health, the nodes, your VMs and containers, storage and backups, live beside your main screen.
Built for homelab and personal use, not for production systems: a glance at your own servers, not a monitoring or alerting tool. Provided as is, without warranty.
The overview
Connections: each Proxmox VE server or cluster, Backup Server and Datacenter Manager with a status dot, its host, nodes up, guests running, and CPU and RAM bars
Attention: what needs you, most urgent first: a connection failing, no quorum, a node or remote down, a locked guest, storage nearly full or filling soon, a failed garbage collection or verify, a backup over a week old. "All good" when nothing does.
Nodes, guests, storage and backups at a glance where the size allows
The pages
Nodes: CPU, RAM and disk bars, uptime, load, cores and version for every node, with the recent tasks beside them
Guests: every VM and container, running first, with CPU, RAM, uptime, tags, HA state and locks, and a summary with the busiest guests
Storage: Proxmox VE storage fullest first, and Backup Server datastores with used space, when they fill, garbage collection and verification
Backups: every backup group oldest first, coloured by age, the guests with no backup at all, and the Backup Server's tasks
Datacenter Manager: every remote, answering or not, with its nodes up and guests running
On the Edge
Choose any size in iCUE, across or upright. Show the overview with page tabs, or one page per widget, and place several.
Show every connection, or one of them per widget. Filter the guests: running, stopped, VMs or containers.
Touch: tap a tab to turn the page; tap a long list to see its next rows. A red dot on a tab says something there needs you.
A 12- or 24-hour clock, and your own text, accent and background colours.
It says what is missing instead of going blank, and which connection stopped answering, with the age of its last figures.
What you need
Proxmox Link, a small Windows program from teatimeservers.ca, or Proxmox & PBS Control for Stream Deck, 2.1.0 or later, from the Elgato Marketplace, with Feed the XENEON EDGE widget ticked (the default). Either reads your servers with your own API tokens and writes the figures to one file on your PC; the widget reads that file. If both run, Proxmox Link writes it and the plugin steps aside.
Proxmox VE 7 or later, Proxmox Backup Server 2 or later and/or Proxmox Datacenter Manager 1.0 or later, reachable from your PC.
iCUE 5.51 or later and a CORSAIR XENEON EDGE, on Windows.
Start the plugin or Proxmox Link once before you place the widget: it makes the folder the widget reads. If you placed the widget first, add it again or restart iCUE.
What it does and does not do
It only reads that one file. It makes no network request, sends nothing, stores nothing, and cannot change your servers.
Your API tokens stay in the plugin or Proxmox Link; the file holds host names and figures only, never a token or secret.
Read-only: it shows your homelab, it does not start or stop anything.
Proxmox Dashboard is an unofficial project, not affiliated with or endorsed by Proxmox Server Solutions GmbH. Proxmox is a registered trademark of Proxmox Server Solutions GmbH.
Proxmox Dashboard 1.0.5
First release.
The overview: every connection's health and totals, and what needs you, most urgent first.
Pages: Nodes, Guests, Storage, Backups and the Datacenter Manager's remotes, each laid out for every XENEON EDGE size, across and upright.
Settings: the overview with page tabs or one page per widget, every connection or one, a guests filter, a 12- or 24-hour clock, your own colours.
Touch: tap a tab to turn the page, tap a long list for its next rows.
Reads the file that Proxmox & PBS Control 2.1.0 or later (Stream Deck) or Proxmox Link (no Stream Deck needed) writes, through iCUE 5.51's file access. Read-only.
Version 1.0.5
Oct 13, 2026
Details
Type
Monitoring
Smart Home
Utilities
Device
XENEON EDGE
OS
Windows
Size
109.73 KB
Version
1.0.5
Language
English
Support
Dashboard Sizes
Extra large
Large
Medium
Small
Recommended Orientation
Horizontal
Vertical
Interactive
Yes
Additional links
You might also like