Monitoring
System Usage
Overview
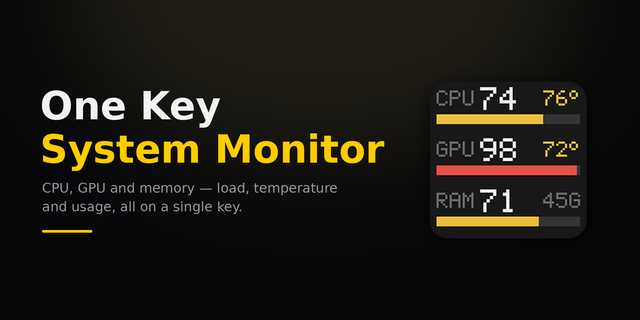
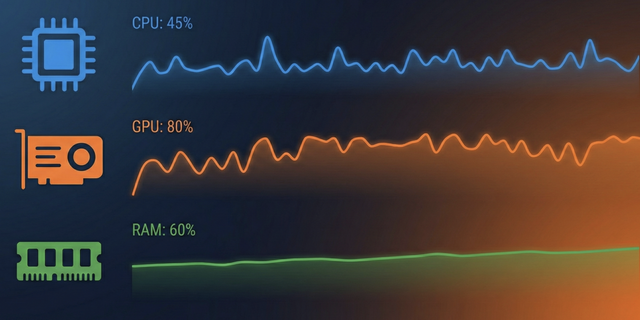
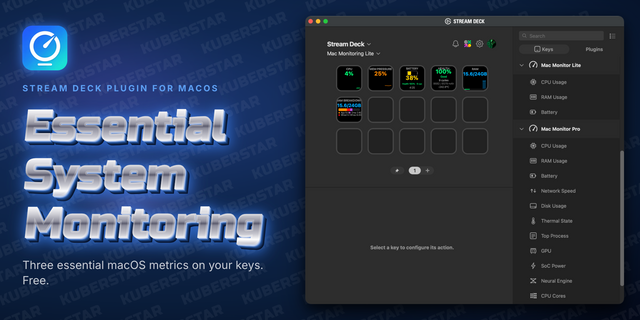
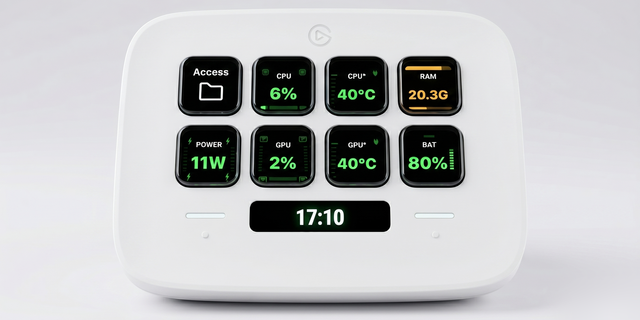
System Usage puts live macOS RAM and CPU load right on your Stream Deck — a clean, color-coded percentage that turns green, yellow, or red the moment your Mac starts working hard. Two actions, Memory and CPU, each with optional history graphs, detail lines, and fully adjustable thresholds. No helper app, no background service, and nothing ever leaves your machine.
MEMORY
Track what actually matters on macOS. Switch between:
• Memory pressure — the same green/yellow/red signal the system itself uses
• Used / total RAM — the familiar "Memory Used" figure, with an optional "34 / 64 GB" line
CPU
• Live CPU utilization, averaged over each refresh interval
• Optional load-average line showing the 1, 5, and 15-minute system load
SEVEN WAYS TO VISUALIZE
Pick the look that fits your deck:
• Ring + percentage (graph off) — clean and minimal
• Sparkline — ring with a subtle trend line
• Mini bars — ring with a small histogram
• Filled area — ring over a soft history fill
• Line graph — large percentage with a prominent line chart
• Bar graph — large percentage with an equalizer-style chart
• Background graph — history fills the whole key behind the number
MAKE IT YOURS
Everything is configurable in the Property Inspector:
• Yellow and red thresholds, set per action
• Custom green / yellow / red colors
• Custom label and refresh interval, down to 1 second
• Press a key to instantly open Activity Monitor
LIGHTWEIGHT & PRIVATE
All values are read straight from the operating system via sysctl, vm_stat, and Node's os module — there is no bundled helper binary and nothing is ever sent over the network. It is a tiny, focused plugin that stays out of your way.
REQUIREMENTS
• macOS 12 or later
• Stream Deck 6.9 or later
• macOS only
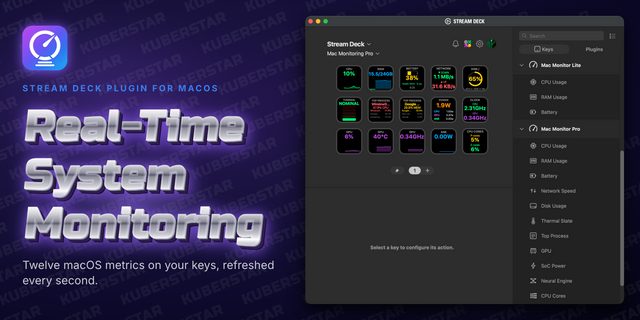
Seven new actions: GPU, Network, Temperature, Fan, Battery, Disk and Disk I/O.
- GPU: utilization with optional GPU memory line.
- Network: download/upload rates in MB/s or Mbps, per interface or all ports.
- Temperature: SoC/CPU, battery or SSD in °C/°F, with fan speed, power or thermal state.
- Fan: RPM, ring shows share of maximum speed.
- Battery: charge with inverted traffic light, time remaining, watts or health.
- Disk: used space of any volume. Disk I/O: read/write rates of all disks.
- CPU and GPU now default to yellow at 60 % and red at 85 %.
Version 1.2
Oct 1, 2026
Details
Type
Monitoring
Utilities
OS
Mac
Compatibility
Stream Deck 6.9 or later
Size
244.01 KB
Version
1.2
Language
English
German
Support
Profiles
No
Dial support
No
Neo Infobar support
No
You might also like